Collaborators
▫️ Christian Omenogor (me) ▫️ Vishesh Sharma▫️ Geetika Palande ▫️ Himali Trivedi ▫️ Kasturi Joshi
What I Did
▫️Planning ▫️ Interview ▫️ Personas ▫️ Think Aloud ▫️ SUS calculation
▫️ Analysis/Report
About DoorDash
This case study reports the evaluation of "DoorDash," a well-known platform for online food ordering and delivery service in the United States, with a 56% and 60% market share in food delivery and in convenience delivery respectively.
DoorDash users may use the mobile app or website to browse menus, order food from a variety of restaurants, and have it delivered to their home or office, providing convenience and dining options.
Why DoorDash
DoorDash is the largest food delivery company in the United States. With this in mind, we noted that success does not eliminate the need for continuous improvement. Therefore, we decided to evaluate how effectively the app meets user expectations in terms of usability, efficiency, and satisfaction.
You Might be Wondering What we Aim to Achieve 🤔
🎯 Assessing user experience: To comprehensively assess the user experience, identifying aspects that enhance or hinder usability, satisfaction, and efficiency.
🎯 Identify issues: To perform task analysis and uncover any pain points or usability issues users encounter while completing the tasks.
🎯 Gather feedback: To gather feedback from participants, and use the feedback to provide insights into users' expectations, preferences, and areas of concern.
🎯 Improve usability: To use the findings from the various methods to inform potential usability improvements, enhancements, or refinements.
What's the Strategy and Rationale?
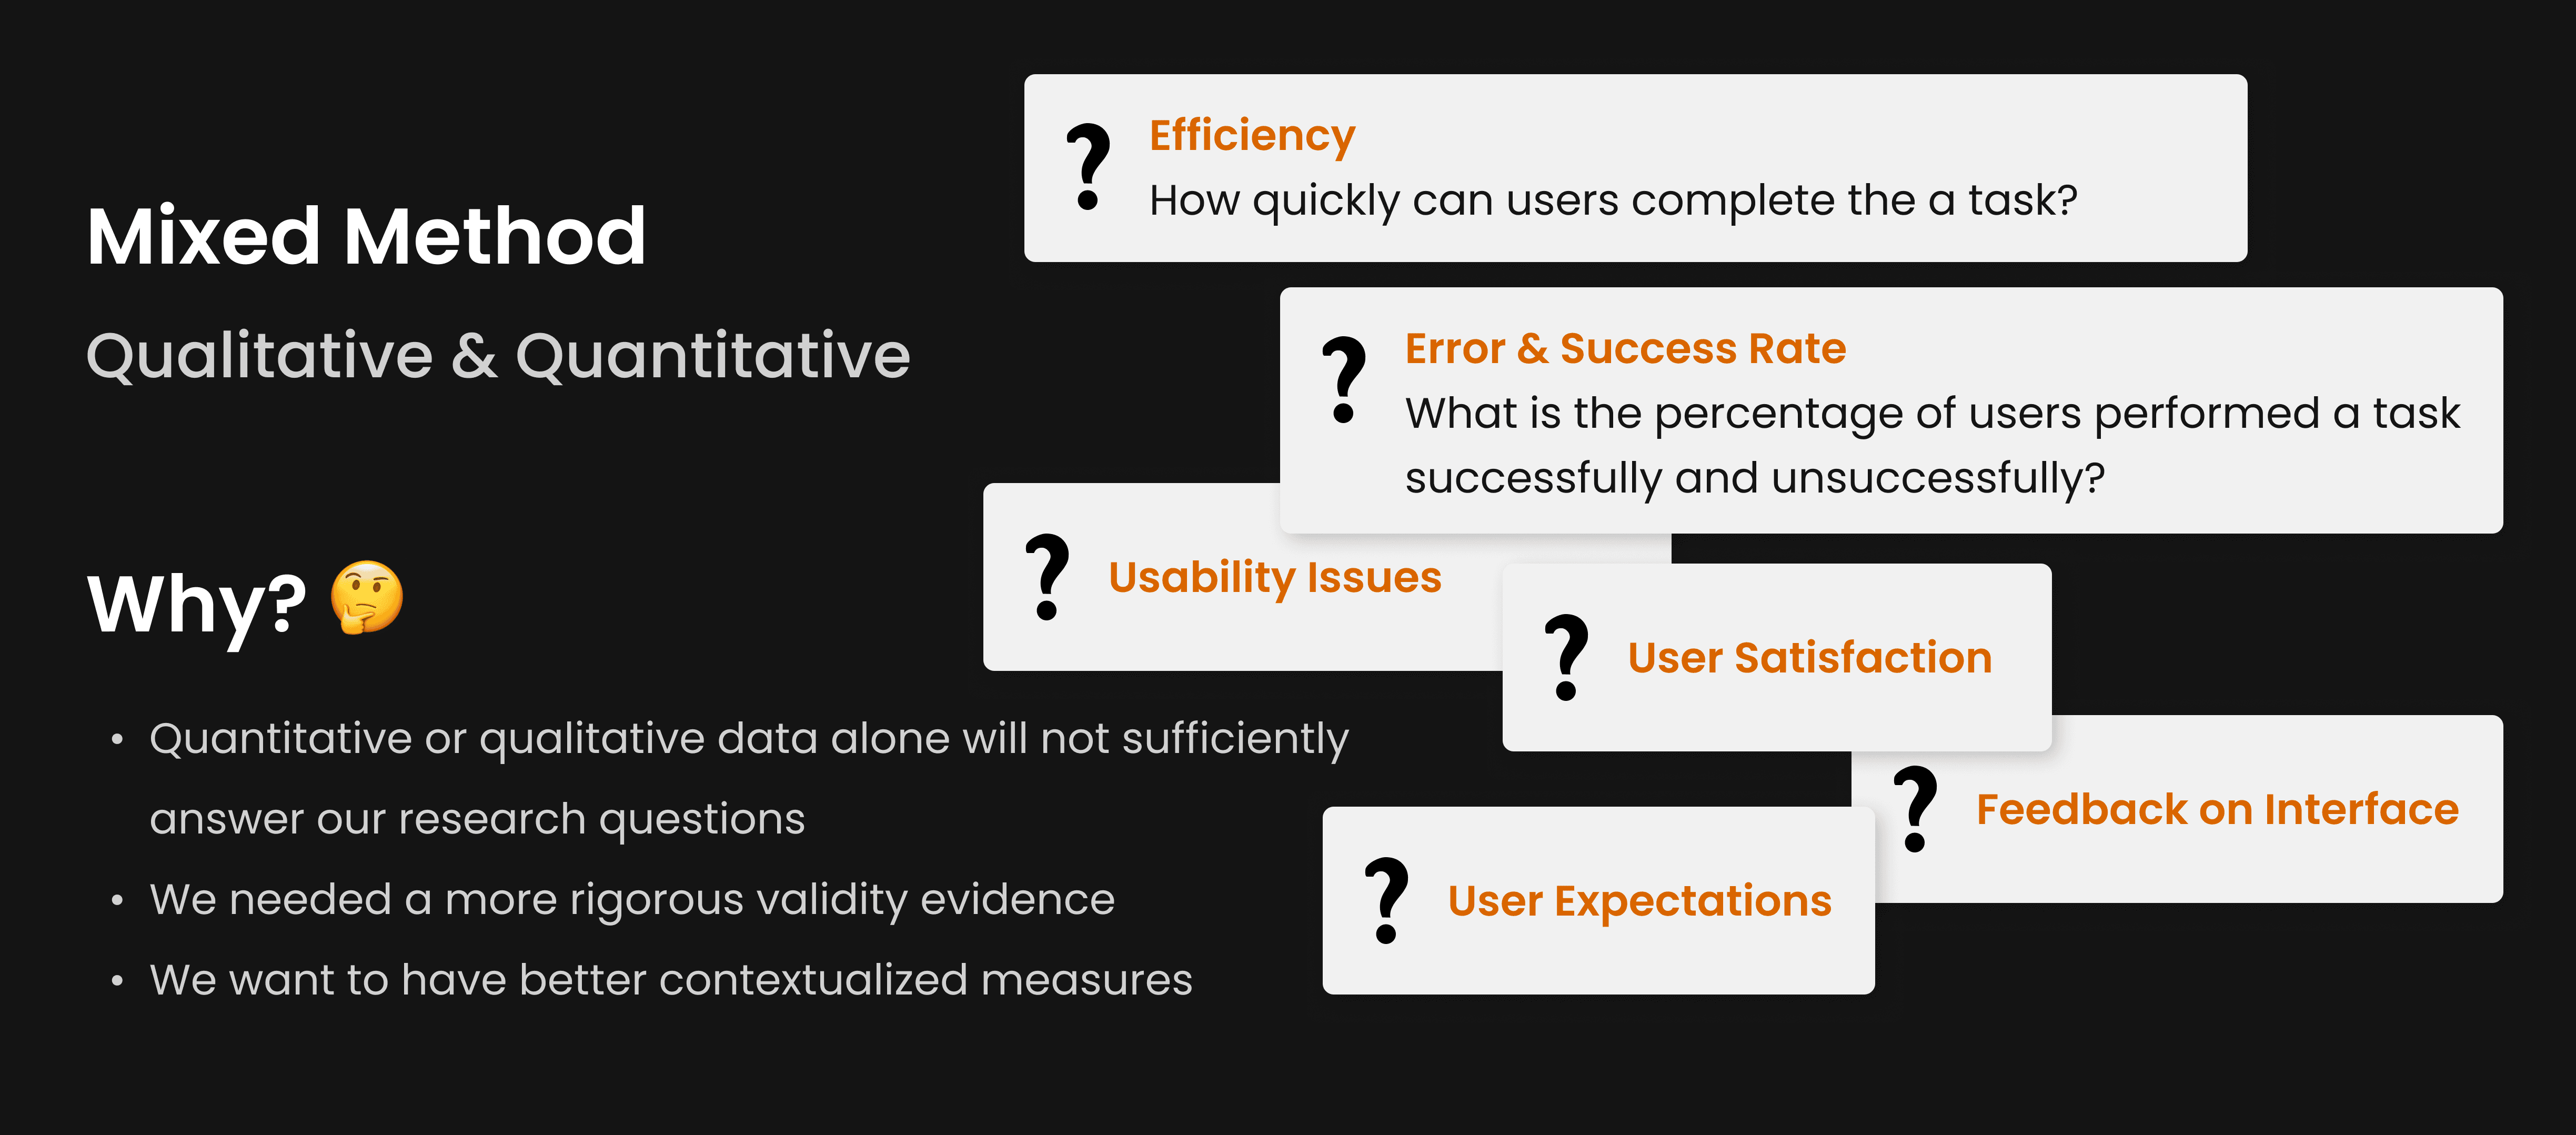
In designing a user experience that aligns with real-world needs, it is critical to understand not only what users are doing but also why they behave the way they do. This dual understanding formed the basis of our research goals and the decision to employ both qualitative and quantitative methods.
Now, here's how we Achieved our Goal…
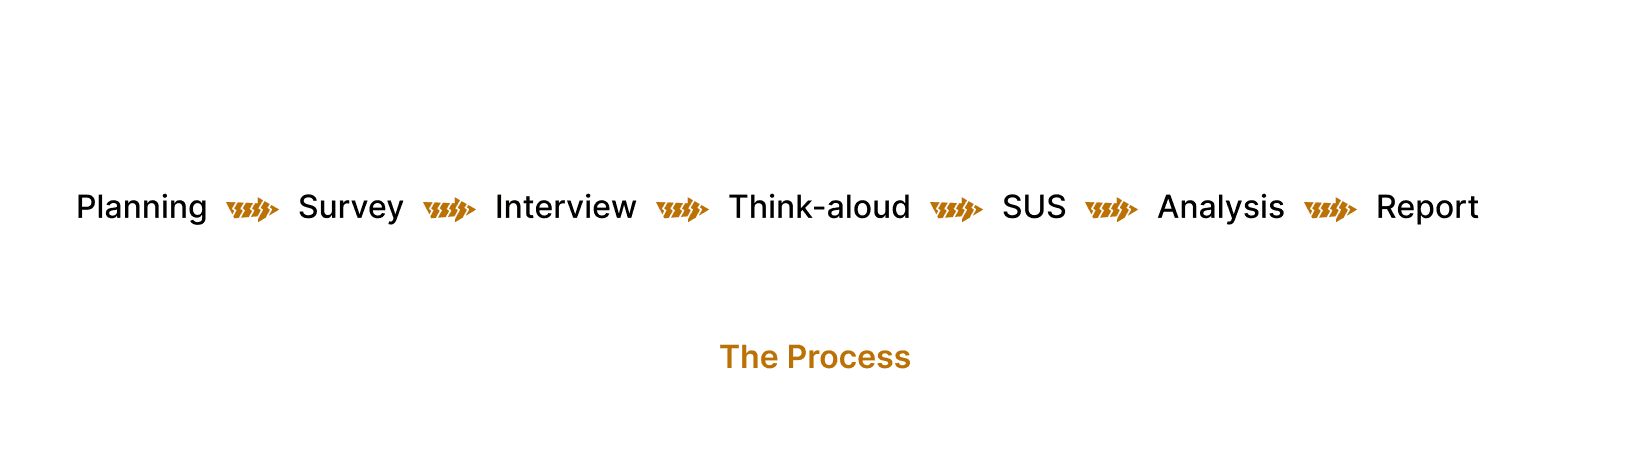
To design an exceptional user experience, every journey begins with a plan, and our mission to assess and improve DoorDash was no different. Armed with curiosity and a commitment to usability, our team embarked on a structured research process to uncover the app's pain points and propose actionable solutions.
Setting the Stage for Discovery - Planning
Before diving in, we aligned our goals: to uncover user challenges, assess the app’s usability, and propose enhancements. We mapped out a process combining quantitative and qualitative methods to ensure a holistic understanding of user experiences. By identifying two key user tasks—ordering vegan food and reporting an issue—we set our focus on areas most likely to reveal usability gaps.
Why it mattered: A clear plan ensured that our efforts were targeted and impactful, leaving no ambiguity about what we needed to achieve.
Capturing User Insights - Survey
Using Google Forms, we designed survey questions collaboratively to capture quantitative data. The survey focused on user demographics, preferences, and broad concerns about food delivery apps. This provided a baseline understanding of user needs and behaviors.
Why it mattered: Surveys are invaluable for quickly gathering data from a large audience, giving us a snapshot of demographic and user sentiments to guide the next steps.
Outcome: The survey highlighted user demographics, platform usage, likes & preferences. These insights helped shape the focus of our deeper exploration.

We had 18 responses, of which 66.7% are within the ages of 21-25 years old. This demographic information gave us an idea of the age group of the majority users of this platform, which informed design recommendations that best fit that age group.
Listening to User Stories - Interviews
To dive deeper, I personally conducted 2 of the 10 in-depth interviews with DoorDash users. These sessions uncovered personal experiences, nuanced frustrations, and unmet expectations, painting a vivid picture of how users interact with the app.
Why it mattered: Interviews allowed us to uncover emotional and contextual insights, enriching the quantitative data from the survey with real-life stories.
Why 10 interviews: The interviews aim to uncover detailed insights rather than statistical generalization, as our focus was on depth over quantity. 10 interviews allowed for us to deeply explore each participant's experience while ensuring enough variety in perspectives.
Outcome: Users expressed confusion with ambiguous labels like “View Receipts” and wished for better dietary preference customization.
Observing Real-time Decisions - Think-aloud
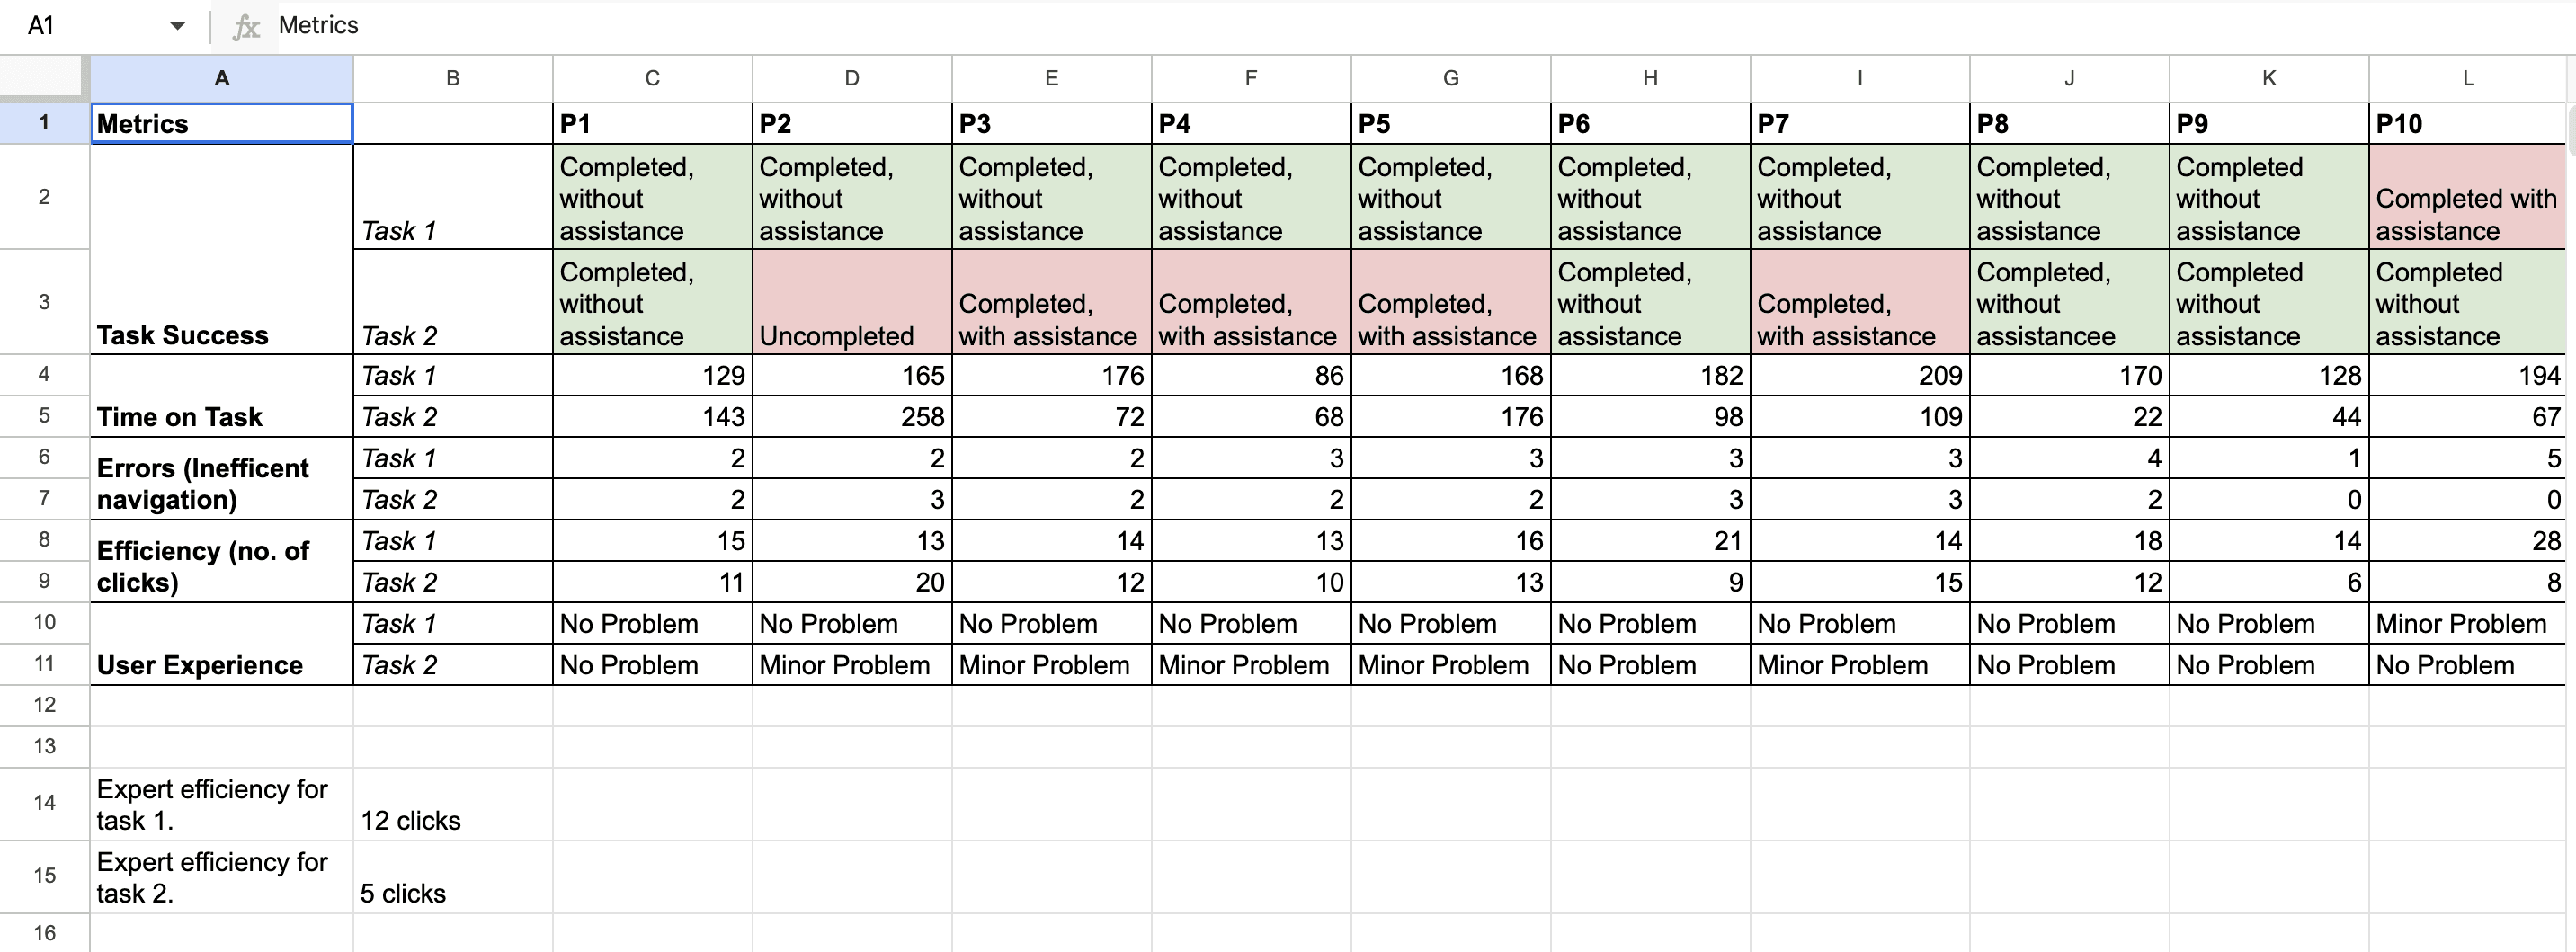
As with the interviews, I facilitated 2 of the 10 think-aloud sessions, where participants performed the 2 focus tasks while verbalizing their thoughts. This method let us observe firsthand how users navigated the app and where they stumbled.
Task 1: Place order for a vegan diet.
Task 2: Report a problem and ask for refund.
Why it mattered: Think-aloud sessions revealed usability roadblocks that users might not articulate in interviews, helping us understand their decision-making processes.
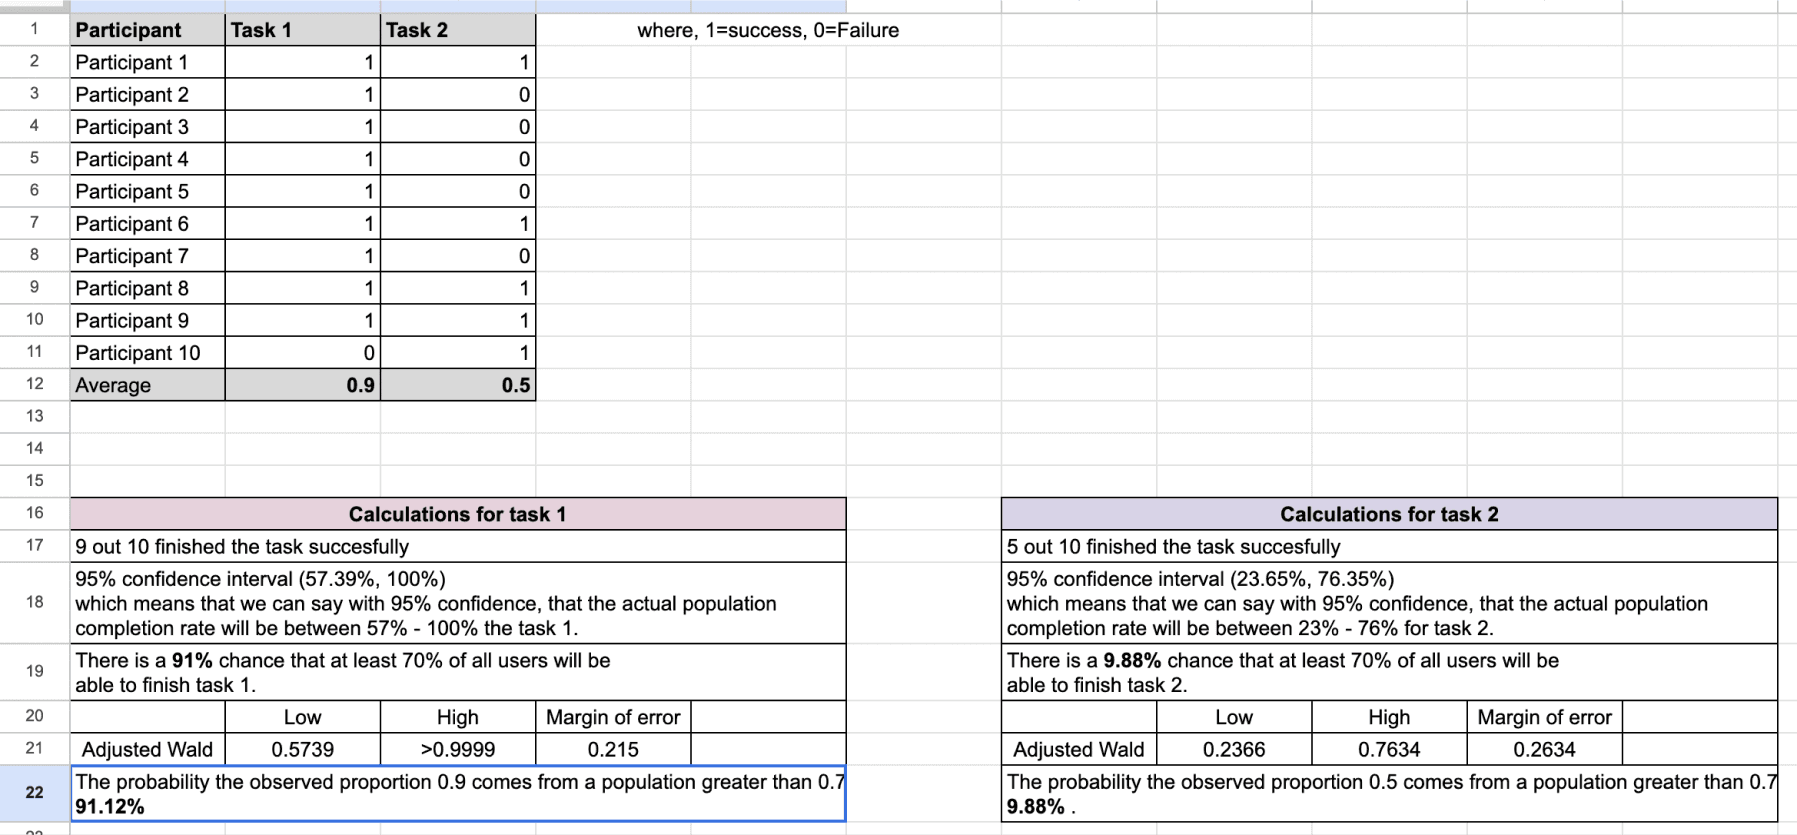
Outcome: Participants slightly struggled with task 1 (identifying vegan-friendly options) due to unclear labeling and found task 2 (reporting issues and request refund) cumbersome, requiring multiple steps, and a 50% failure rate.
Measuring Usability - System Usability Scale (SUS)
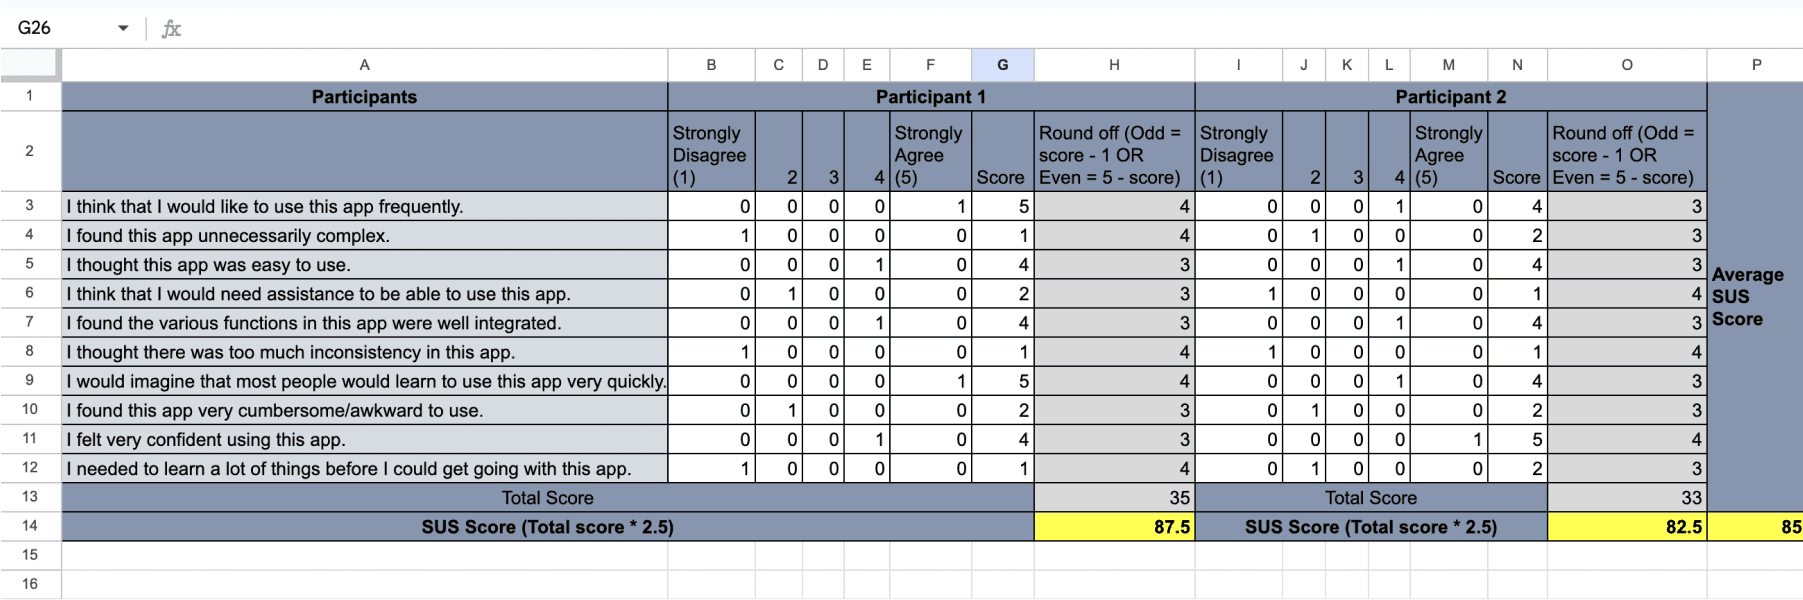
To quantify the app’s overall usability, we administered the SUS to all participants. Each of us evaluated our individual participants' responses, ensuring consistency and breadth in data collection.
Why it mattered: SUS provided a standardized metric to compare usability across tasks, reinforcing our findings with quantifiable evidence.
Outcome: The SUS scores confirmed what we observed qualitatively—task 1 (ordering vegan food) had a much higher success rate than task 2 (reporting an issue), with notable usability concerns in the latter.
Connecting the Dots - Analysis
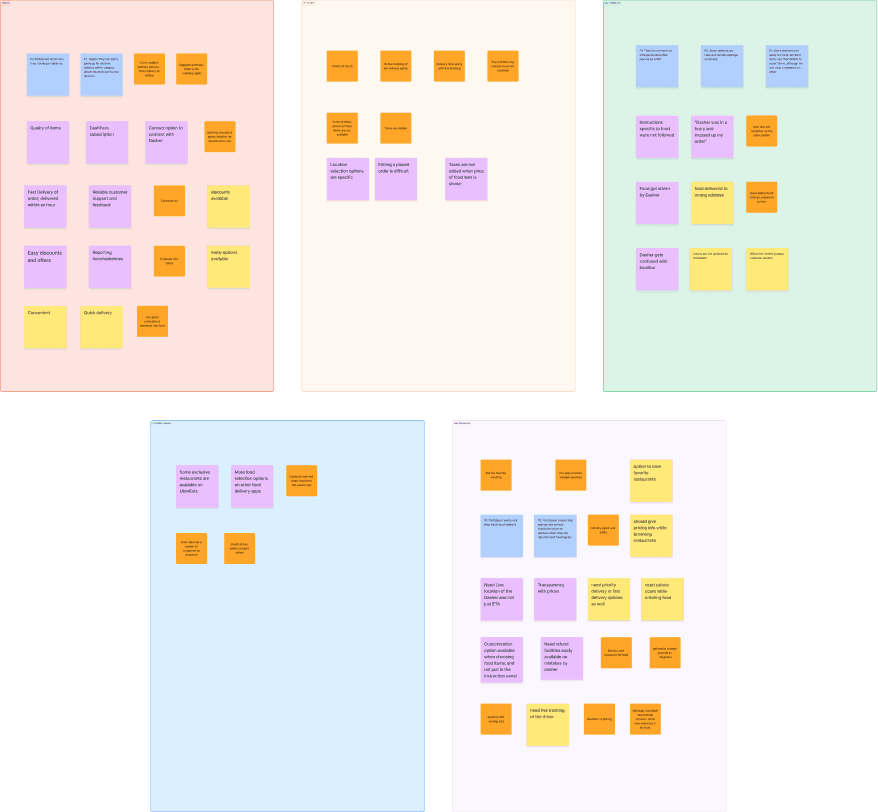
We performed thematic analysis on the data, categorizing user feedback into themes such as "UI concerns," "user frustrations," "competitor features," and "user expectations." By synthesizing these insights, we identified actionable recommendations for improvement.
Why it mattered: Thematic analysis ensured no insights were overlooked, enabling us to translate raw data into meaningful, user-focused solutions.
Outcome: Clear themes emerged, such as the need for intuitive vegan filters and simplified issue-reporting flows.
Further analysis went into identifying likely outcomes of the problems identified. We used binomial distribution to make statistical Inference. To achieve this, we highlighted 10 common problems amongst participants.
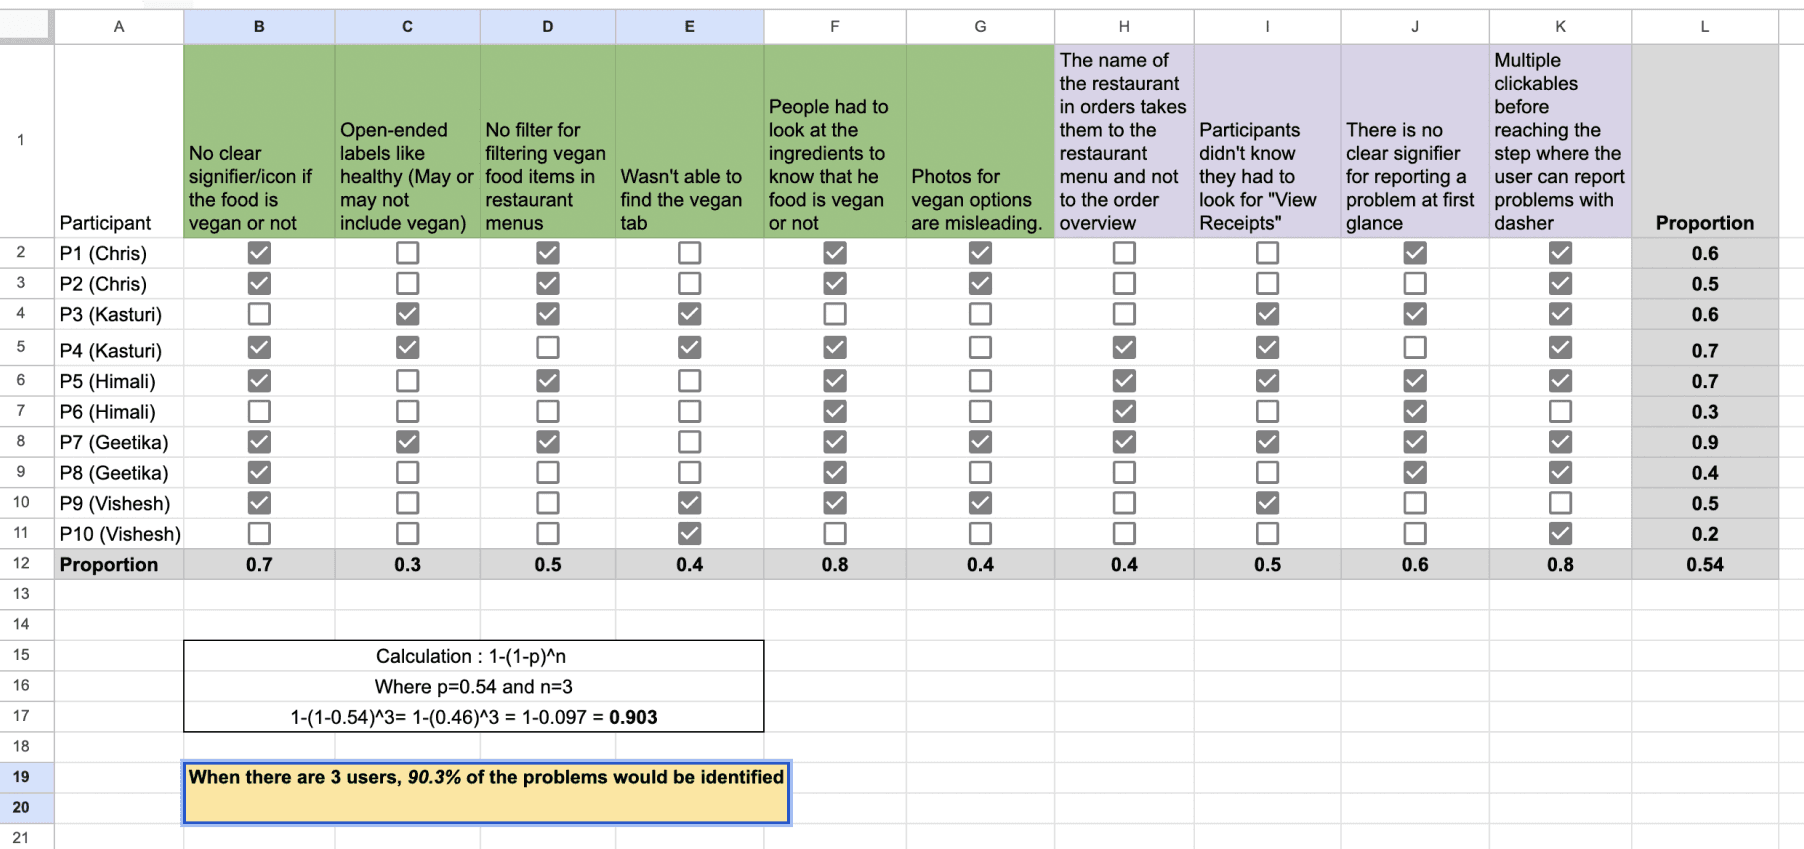
Outcome: when there are 3 users, 90.3% of the problems highlighted above would be identified
Turning Insights into Action - Report
Finally, we consolidated our findings into a comprehensive report, detailing the challenges users faced and proposing solutions like dietary preference filters and a “Report an Issue” button. The report served as a roadmap for enhancing DoorDash’s usability.
Why it mattered: A well-crafted report bridges the gap between research and implementation, ensuring stakeholders can act on insights effectively.
Outcome: A clear and actionable document that not only outlined the issues but also justified each recommendation with data.
Key Findings
Task 1
There is no clear signifier/icon if the food is vegan or not.
Open-ended labels like healthy (may or may not include vegan).
No filter for filtering vegan food items in restaurant menus.
Task 2
Participants didn't know they had to look for "View Receipts".
There is no clear signifier for reporting a problem at first glance.
Multiple clickables before reaching the step where the user can report the dasher.
Overall
Likelihood that at least 70% of all users could complete each of the two tasks.
From our calculations, we could infer that-There is a 91% chance that 70% of all users will be able to finish task 1.
There is a 9.88% chance that 70% of all users will be able to finish task 2.
When there are 3 users, 90.3% of the 10 issues would be identified.
Recommendations
Task 1:
There should be clear indicators for vegan dishes. For example: A green dot or a green leaf symbol.
When the user signs up for the first time, ask for dietary preferences and show different tabs based on it on the home page.
There could be a filter option for filtering out vegan options under a restaurant menu.
Task 2:
Instead of “View Receipts”, the wording can be changed to “Report a problem” so that the users aren’t confused.
There are multiple clickable steps before reaching the final step of reporting the problem, this can be made direct my introducing a button named “Report an issue”.
Conclusion
This process was more than a series of research activities—it was a journey to empathize with users, understand their needs, and design solutions that matter. Each step brought us closer to creating an app that feels intuitive, inclusive, and responsive to its users. Through planning, listening, observing, measuring, and analyzing, we turned user pain points into actionable design opportunities, paving the way for a better DoorDash experience.